Microsoft ends support for Internet Explorer on June 16, 2022.
We recommend using one of the browsers listed below.
- Microsoft Edge(Latest version)
- Mozilla Firefox(Latest version)
- Google Chrome(Latest version)
- Apple Safari(Latest version)
Please contact your browser provider for download and installation instructions.


Toward a better us
NTT Group is pursuing
sustainability for society.
Sustainability
The NTT Group pursues sustainability initiatives to help create the sustainable society we envision.
-

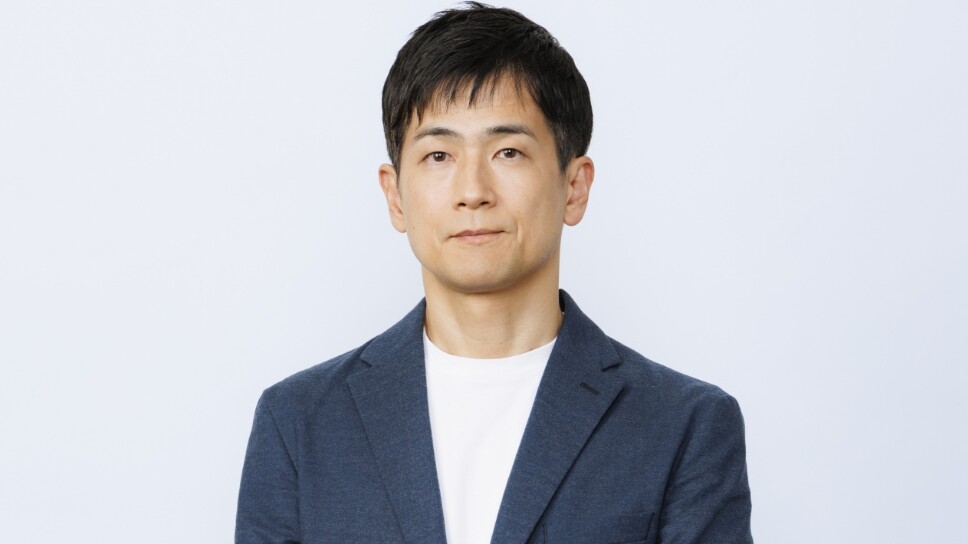
Message from Management
A message from the president and chief executive officer of the NTT, Inc., the holding company for the NTT Group.
-

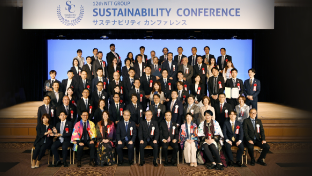
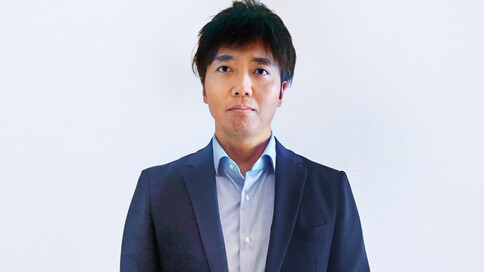
Sustainability Management
The concept of "Self as We" forms the basis of NTT Group's efforts to contribute to the realization of a sustainable society.
NTT
MATERIALITY
Materiality
Materiality is determined for the three themes for achieving the sustainable society that NTT is envisioning based on the GRI materiality standards and processes.
ESG
-
Social


Related information
CSR website of the NTT Group companies
These are links to the CSR site of each NTT Group company.
NTT STORY
WEB media that thinks about the future with NTT