Microsoft ends support for Internet Explorer on June 16, 2022.
We recommend using one of the browsers listed below.
- Microsoft Edge(Latest version)
- Mozilla Firefox(Latest version)
- Google Chrome(Latest version)
- Apple Safari(Latest version)
Please contact your browser provider for download and installation instructions.


Detailed data
- Reduction of Greenhouse Gas Emissions across Society
- Power Efficiency of the Telecommunications Business
- NTT Group's Greenhouse Gas Emissions
- CO2 Emissions of NTT Group
- Recycling Rate of Waste
- Final Disposal Ratio of Waste
- Waste Discharged by NTT Group
- Hazardous Waste
- Paper Management and Recycling
- Water Use and Withdrawal
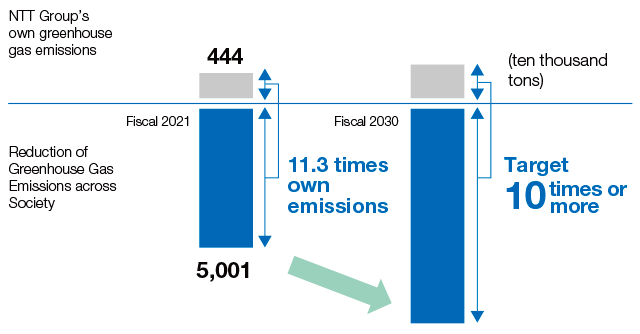
Reduction of Greenhouse Gas Emissions across Society
*You can scroll horizontally
| (Fiscal year) | 2019 | 2020 | 2021 |
|---|---|---|---|
| Reduction of Greenhouse Gas Emissions across Society | 12.5 times | 10.5 times | 11.3 times |
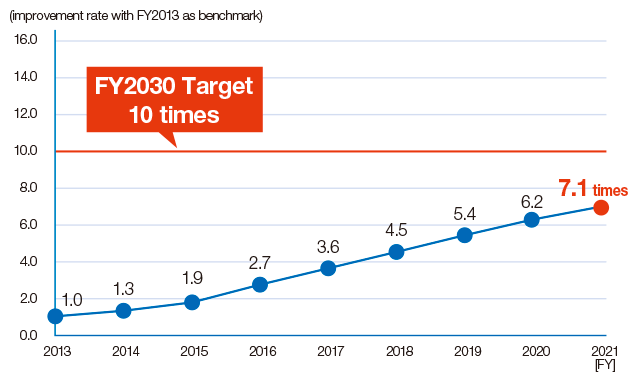
Power Efficiency of the Telecommunications Business
 Power Efficiency of the Telecommunications Business
*You can scroll horizontally
| (Fiscal year) | 2019 | 2020 | 2021 |
|---|---|---|---|
| Power Efficiency of the Telecommunications Business | 5.4 times | 6.2 times | 7.1 times |
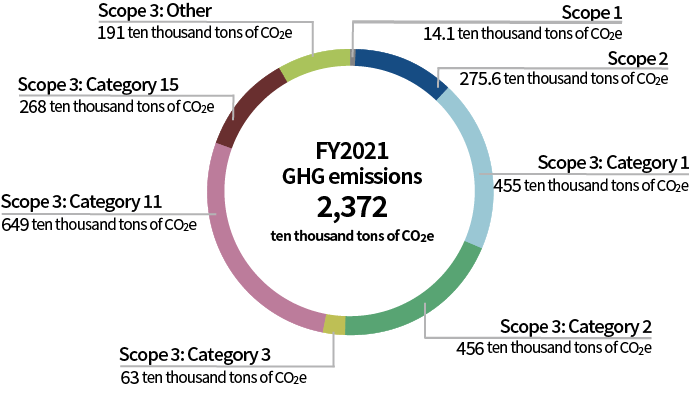
NTT Group's Greenhouse Gas Emissions
Greenhouse Gas Emissions (by Scope)
*You can scroll horizontally
| Scope category | Scope and method of calculation | Fiscal 2021 Emissions (ten thousand tons of CO2e) |
|
|---|---|---|---|
| GHG emissions (Scope 1 + 2 + 3) | ‐ | 2,372 | |
| Scope 1 (direct emissions) | ‐ | 14.1 | |
| Scope 2 (indirect emissions from energy use) | ‐ | 275.6 | |
| Scope 3 (indirect emissions from the value chain) | 2,082 | ||
| Category 1: Purchased goods and services | Calculation based on the number of units and monetary value of purchases of devices and services sold to customers | 455 | |
| Category 2: Capital goods | Calculation based on capital investment costs on telecommunications and other equipment | 456 | |
| Category 3: Fuel- and energy-related activities not included in Scope 1 or 2 | Calculation based on annual consumption by energy type | 63 | |
| Category 4: Upstream transportation and distribution | Calculation based on weight and distance, or number of devices with regard to the transport of devices sold to customers | 8 | |
| Category 5: Waste generated in operations | Calculation based on volume of waste by type | 1 | |
| Category 6: Business travel | Calculation based on paid expenses for business travel | 3 | |
| Category 7: Employee commuting | Calculation based on paid expenses for employee commuting | 4 | |
| Category 8: Upstream leased assets*1 | Excluded from calculation*1 | ‐ | |
| Category 9: Downstream transportation and distribution*2 | Excluded from calculation*2 | ‐ | |
| Category 10: Processing of sold products*3 | Excluded from calculation*3 | ‐ | |
| Category 11: Use of sold products | Calculation based on number of service subscriptions, number of devices and monetary value of telecommunications services and devices used by customers | 649 | |
| Category 12: End-of-life treatment of sold products | Calculation based on number of service subscriptions, number of devices and monetary value of communications devices used by customers | 4 | |
| Category 13: Downstream leased assets | Calculation based on amount of electricity consumption such as equipment by other business Calculation based on average use of leased assets | 164 | |
| Category 14: Franchises | Calculation based on total floor area of sales franchises | 8 | |
| Category 15: Investments | Calculation based on Scope 1 and 2 emissions of investees in proportion to shareholding | 268 | |
- We have excluded Category 8 (upstream leased assets) from the calculation because the fuel and electricity used by leased assets is included in Scope 1 and 2 calculations.
- We have excluded Category 9 (downstream transportation and distribution) from the calculation because these emissions are almost entirely from our own transportation and use in our own facilities (included in Scope 1 and 2) or from outsourced transportation (included in Category 4).
- We have excluded Category 10 (processing of sold products) from the calculation because our main businesses involve no processing of intermediate products.
*Calculations for Scope 3 is based on the Ministry of the Environment's Basic Guidelines on Accounting for Greenhouse Gas Emissions Throughout the Supply Chain (Ver. 2.3). Emission intensity of each company is used for some supplier (calculated from figures released by each company).
CO2 Emissions of NTT Group
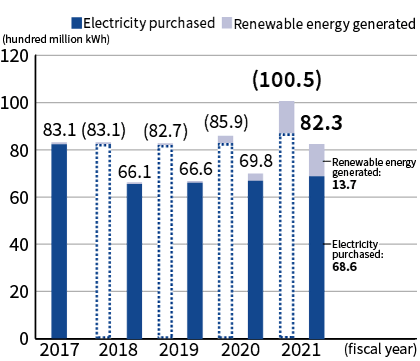
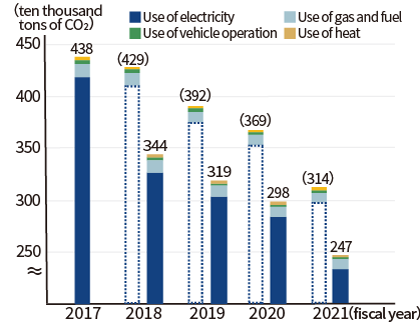 CO2 Emissions from Business Operations
*You can scroll horizontally
| Fiscal year | 2017 | 2018 | 2019 | 2020 | 2021 |
|---|---|---|---|---|---|
| Electricity purchased (hundred million kWh) | 82.3 | 65.4 (82.4) |
65.9 (82.0) |
66.7 (82.8) |
68.6 (86.8) |
| CO2 attributable to electricity consumption (ten thousand tons of CO2) | 418 | 326 (412) |
303 (376) |
284 (354) |
233 (300) |
| CO2 attributable to gas and fuel consumption (ten thousand tons of CO2) | 13.5 | 11.8 | 10.1 | 9.6 | 9.0 |
| CO2 attributable to company vehicles (ten thousand tons of CO2) | 3.3 | 3.1 | 2.7 | 2.1 | 2.0 |
| CO2 attributable to heating (ten thousand tons of CO2) | 2.7 | 2.9 | 3.0 | 2.9 | 2.8 |
| Total CO2 emissions (ten thousand tons of CO2) | 438 | 344 (429) |
319 (392) |
298 (369) |
247 (314) |
- The CO2 emissions from business operations exclude emissions of greenhouse gases other than CO2.
- The NTT Group provides equipment and the like necessary for other telecommunications carriers and data center providers to carry out their businesses. To date, we have included the fuel and electricity required for this equipment in our disclosed emission and consumption volumes in accordance with reporting methods outlined by the Act on Promotion of Global Warming Countermeasures. However, as calculation methods have been established based on the Ministry of the Environment's Basic Guidelines on Accounting for Greenhouse Gas Emissions Throughout the Supply Chain (Ver. 2.3), we have adopted these for calculating the above CO2 emissions as Scope 3. Emission amounts calculated using the previous method have been placed within parentheses. Similarly, for amounts of electricity purchased and total amount of non-renewable energy, from fiscal 2018 onward we are excluding the amount consumed by other telecommunications carriers and data center providers, and values calculated using the previous method will be placed within parentheses, and we have adopted these for calculating the above CO2 emissions as Scope3 from fiscal 2019.
 Electric Power Consumption
Recycling Rate of Waste
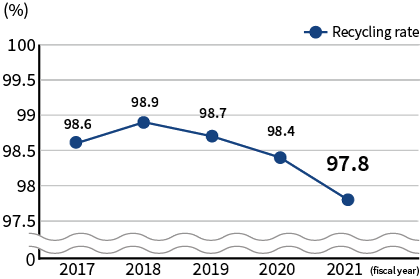 Recycling Rate
Final Disposal Ratio of Waste
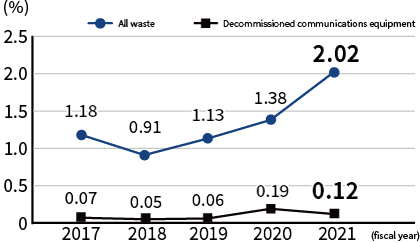 Final Disposal Ratio
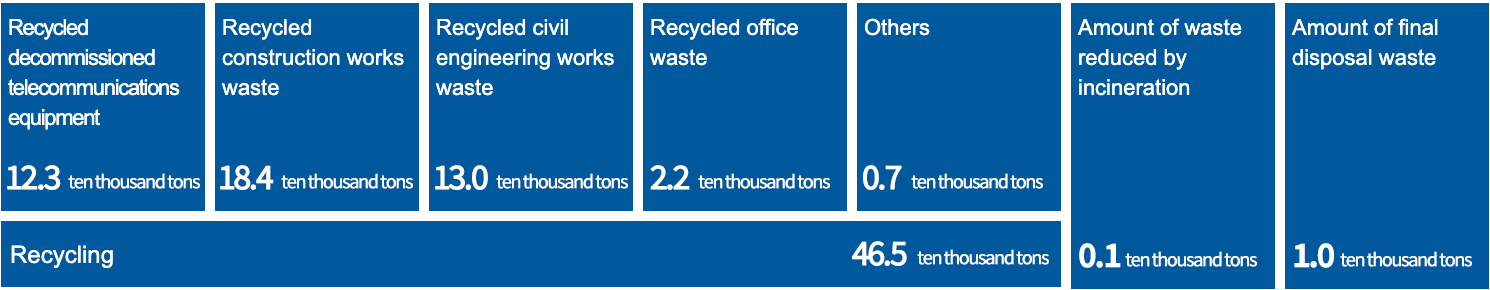
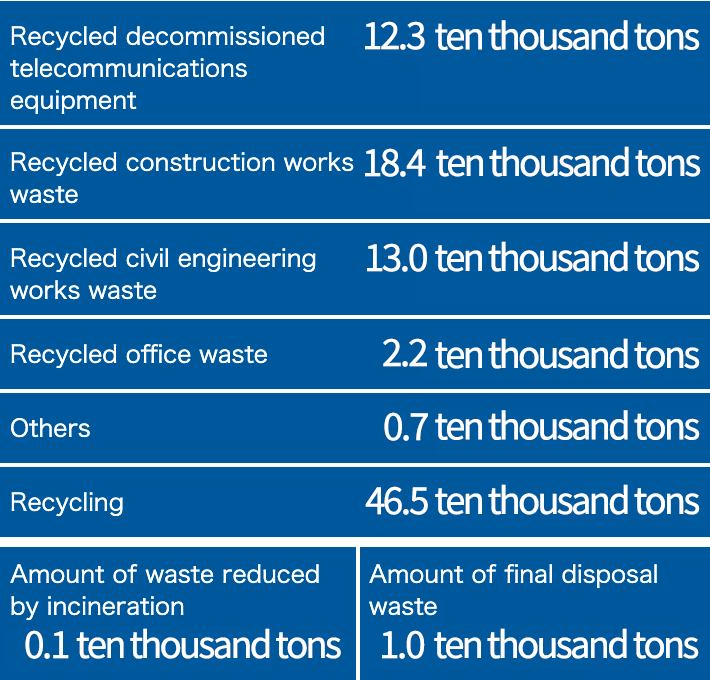
Waste Discharged by NTT Group
Results of Recycling, Waste Reduction and Final Disposal
Results of Recycling, Waste Reduction and Final Disposal
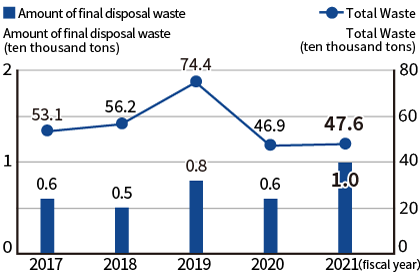 Waste and Final Disposal Waste
Hazardous Waste
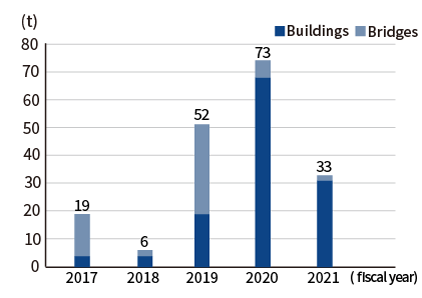 Asbestos removed from NTT Group Facilities
Paper Management and Recycling
-
 Virgin Pulp Consumption
-
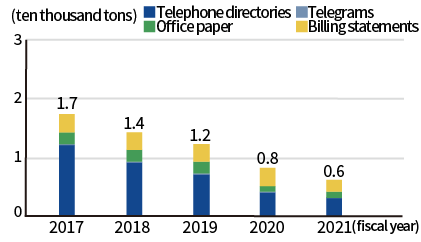
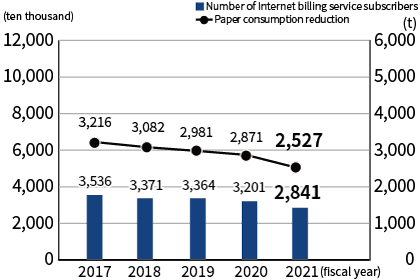 Paper Consumption Reductions from NTT Internet Billing Services
Water Use and Withdrawal
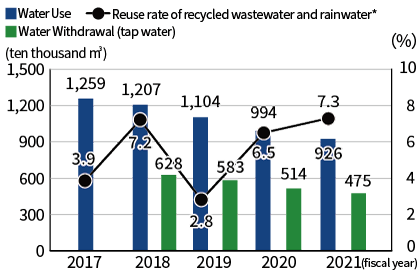 Water Use and Withdrawal
*The reuse rate shown up to fiscal 2017 corresponds to the total volume of tap water and sewage, recycled water, and rainwater used, while the reuse rate from fiscal 2018 onward corresponds to the total volume of tap water, recycled water, and rainwater.
Environmental data
NTT Group Environmental Activities
NTT STORY
WEB media that thinks about the future with NTT
-
June 27, 2025
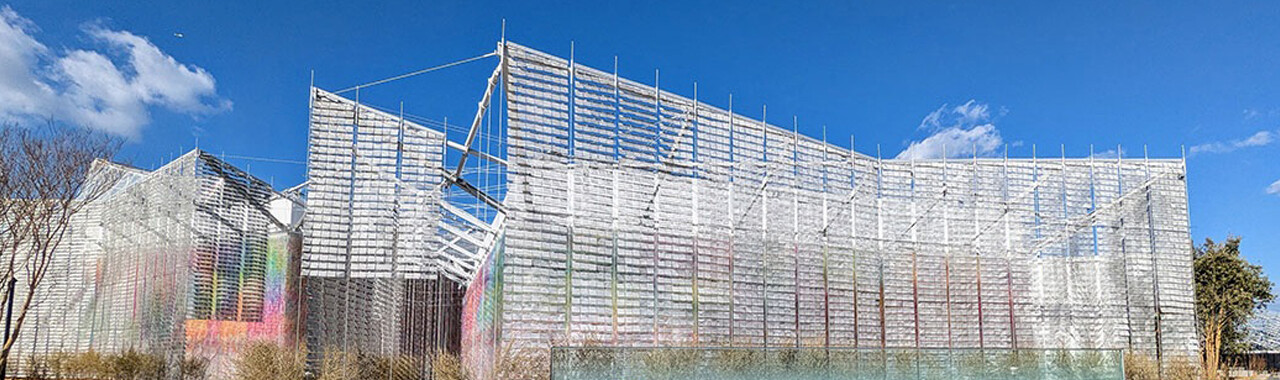
The NTT Pavilion Delivering a 3D Performance from the Future... and the Past?
-
June 27, 2025
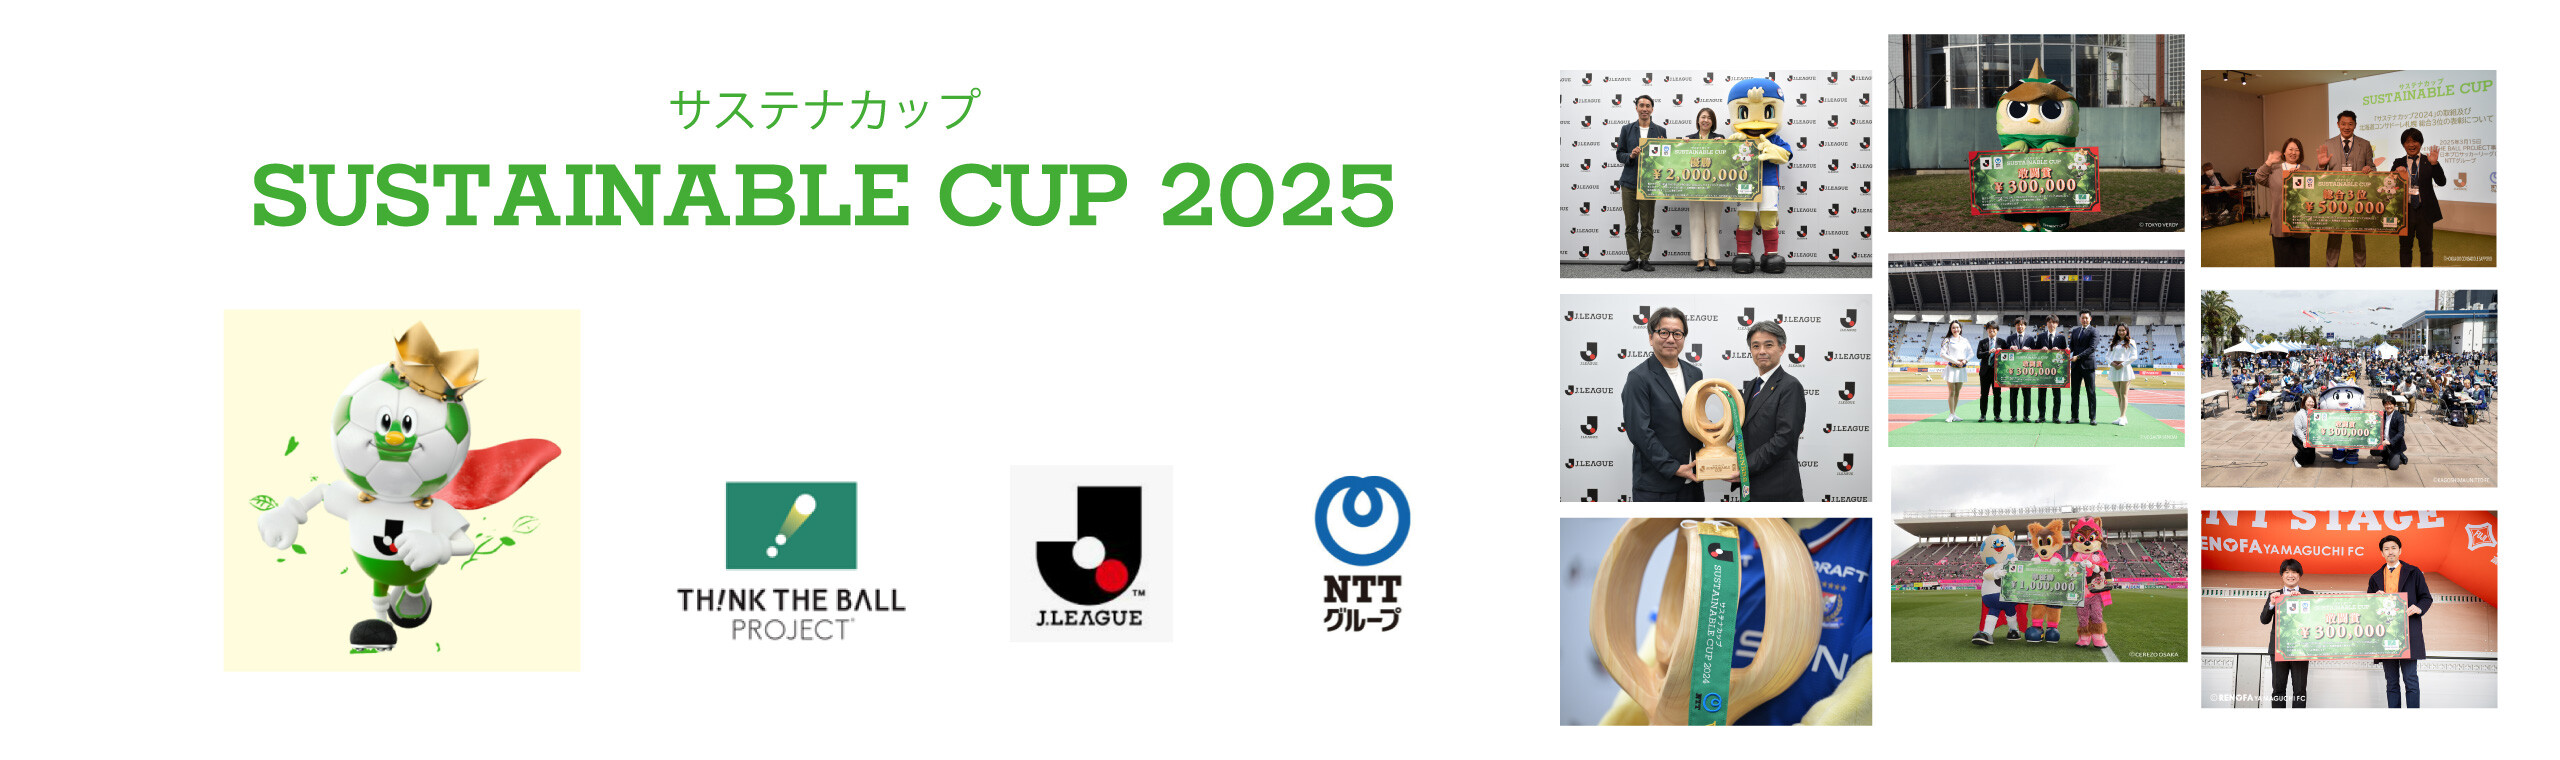
Results of the "Sustaina Cup 2024," the central initiative of the "TH!NK THE BALL PROJECT" by NTT Group and the J-League, and the outlook for the future
-

June 20, 2025
NTT, CHO-KABUKI and Expo 2025