Microsoft ends support for Internet Explorer on June 16, 2022.
We recommend using one of the browsers listed below.
- Microsoft Edge(Latest version)
- Mozilla Firefox(Latest version)
- Google Chrome(Latest version)
- Apple Safari(Latest version)
Please contact your browser provider for download and installation instructions.


April 30, 2025
NTT Corporation
World's First: Technology Developed to Predict Corrosion Progression from Steel Infrastructure Images
Reduce maintenance costs by optimizing inspection cycles and repair timing through forecasting the future condition of structures such as road bridges
News Highlights:
- We have developed a groundbreaking technology that can generate predictive images showing the future spread of steel corrosion based on current photos of infrastructure such as road bridges
- It achieves high-accuracy forecasts of corrosion spread rate1 in steel materials, with a mean error2 of less than 10%
- It enables precise prediction of future corrosion conditions for each facility, making it possible to optimize inspection intervals and repair timing, and significantly reduce maintenance costs through more efficient asset management
TOKYO - April 30, 2025 - NTT Corporation (Headquarters: Chiyoda, Tokyo; President and CEO: Akira Shimada; hereinafter "NTT") has developed a groundbreaking technology that accurately predicts the progression of steel corrosion several years into the future using images of infrastructure such as road bridges taken with a digital camera (Figure 1). This is the world's first inspection technology capable of generating predictive images that visualize the future spread of corrosion based on actual photos. By training the system on data from real-world corroded facilities and their environmental conditions, the technology enables high-precision image-based predictions. Verification tests using road bridges and telecommunications conduit facilities3 installed along roads confirmed that the technology can forecast the future spread of corrosion with a mean error of less than 10% (9.9%).
With this technology, the future state of corrosion can be predicted with high accuracy, making it possible to optimize inspection intervals and repair schedules. This leads to significant cost savings by fundamentally improving the efficiency of maintenance operations.
The technology is scheduled to be commercialized in FY2025 through its implementation on road bridges managed by NTT Group companies. In addition, expansion to other types of deterioration—such as cracking and tearing—is underway, contributing to the realization of a more sustainable society.
This technology will be showcased at "Tsukuba Forum 2025"4, to be held from May 15 (Thu) to 16 (Fri), 2025 (JST).
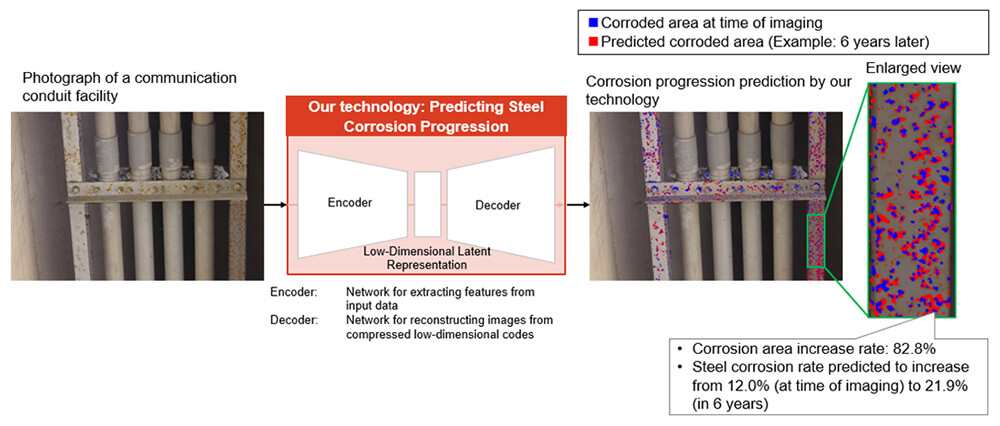 Figure 1 Prediction of Steel Corrosion Progression Using This Technology
Background
A large number of steel-structured infrastructure facilities—such as bridges, transmission towers, and guardrails—have been installed across the country. The aging of these facilities has become a major social issue. The primary cause of this deterioration is corrosion of steel materials. Since most infrastructure is installed outdoors, steel components are exposed to rain, wind, condensation, and other environmental factors, which leads to corrosion. Corrosion progresses gradually over time, weakening the structural strength5 of facilities, and in severe cases, it may lead to damage or collapse. For this reason, facility managers must regularly inspect corrosion conditions and ensure safe and reliable maintenance.
However, under the current system, inspections are conducted at fixed intervals for all facilities regardless of their condition, resulting in enormous costs every year. Moreover, with the increasing number of aging structures and the shortage of skilled technical personnel, the burden on infrastructure managers is expected to grow even heavier in the coming years.
To address this challenge, it is essential to fundamentally rethink the current uniform inspection cycle and shift toward a system that allows optimal inspections and repairs tailored to the corrosion progression of each individual facility. This requires a method capable of accurately predicting the future corrosion state of every facility.
Challenges in Predicting Steel Corrosion Progression
• Field Survey on Corrosion Area Growth Rates
Figure 2 shows the measured increase in corrosion area on steel components of actual steel structures. This field survey was conducted by NTT Access Network Service Systems Laboratories, targeting 80 steel components on road bridges and telecommunications conduit facilities attached to road bridges in Ibaraki Prefecture. The study measured the increase in corrosion area after a set number of years had passed. The time spans observed ranged from 3 to 6 years, with 20 facilities analyzed for each year. Ibaraki Prefecture was selected as the survey location because its environmental conditions—such as temperature and precipitation, which affect corrosion progression—are close to the national average, making it suitable for collecting standard reference data.
According to the survey results, the average corrosion area growth rates were 64.4% after 3 years, 146.4% after 4 years, 99.2% after 5 years, and 79.8% after 6 years. These findings indicate that there was no clear trend showing that corrosion area growth consistently increases in proportion to elapsed time. This suggests that it is difficult to accurately predict the corrosion progression of individual facilities based on elapsed years alone.
 Figure 2 Relationship Between Facility Age and Corrosion Area Growth Rate
• Existing Technologies
Several methods have been proposed to estimate the rate of corrosion progression—which is difficult to predict based on elapsed years alone—by applying statistical or machine learning techniques using environmental factors such as average temperature, precipitation, and sunlight duration.
However, these are macro-level approaches that estimate the average annual corrosion rate across regional units such as prefectures or municipalities. There is currently no method capable of accurately predicting corrosion progression at the level of individual facilities.
Overview of the Technology
A new technology has been developed that accurately predicts the progression of steel corrosion several years into the future using images of infrastructure captured by a digital camera. This technology generates predictive data on future corrosion spread by inputting three key elements: an image of the facility, environmental data for the facility's location (such as temperature and precipitation), and the number of years to be forecasted (Figure 3).
The images used in this technology were taken of steel components on road bridges and telecommunications conduit facilities owned by NTT. These images were collected over several decades during regular facility inspections conducted by NTT. It should be noted that this dataset excludes coastal areas and other salt-damage-prone environments where corrosion typically progresses more rapidly.
[Technical Highlights]
This technology is built upon a deep learning technique known as a Generative Adversarial Network (GAN)6. A GAN is a type of generative model that learns features from input data to create realistic, synthetic data.
We developed a custom GAN-based model that incorporates elapsed time and corrosion progression data, along with past and present images of facilities. This enables the model to learn detailed characteristics of corrosion—such as its area, shape, and color. In addition, the model is designed to take in environmental data—such as temperature and precipitation—that are assumed to influence corrosion from a chemical perspective. From multiple environmental variables, the most relevant parameters are selected and input together with the images. As a result, we successfully established a model capable of accurately predicting the progression speed of individual corrosion spots within the image.
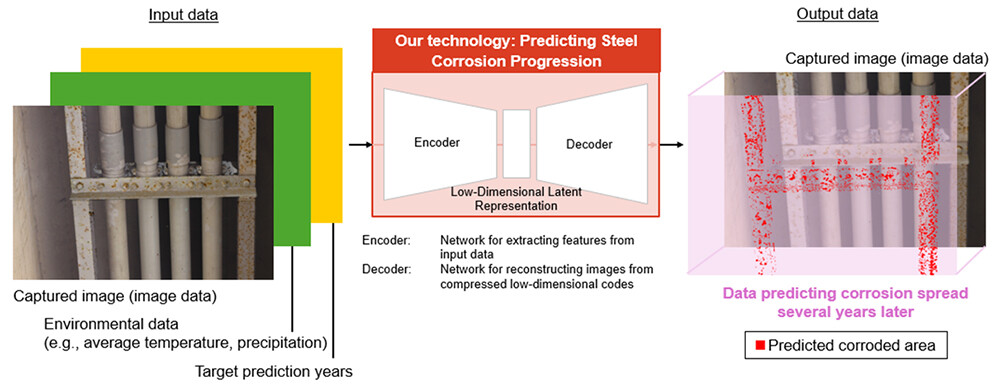 Figure 3 Overview of How the Technology Works: Input and Output Data
Verification Overview
• Verification Conditions
The performance of this technology was verified using images of 20 steel components from road bridges and telecommunications conduit facilities installed in the field. Verification images were collected by re-photographing the same locations using the same angle and composition as images taken several years ago by NTT. The average elapsed time for the 20 steel components used in the verification was 4.4 years.
For evaluation, the increase in corrosion area was first calculated by comparing past and current images. Then, the increase in corrosion area was also calculated using the past image and the prediction image generated by this technology. Finally, the values from the actual corrosion progression and the predicted progression were compared to assess accuracy.
• Verification Results
Figure 4 shows the comparison between the actual corrosion area growth rate (from past to present images) and the predicted growth rate generated by this technology. The correlation coefficient7 was found to be 0.738, indicating a strong correlation between actual and predicted values. The mean error between actual and predicted growth rates was 9.9%, and the variance8 was 3.7%.
In Figure 4, both Point A and Point B represent facilities with an elapsed time of three years, yet the actual growth rates differ by approximately 40%. Despite this, the technology successfully predicted the corrosion spread for each facility in alignment with their actual conditions.
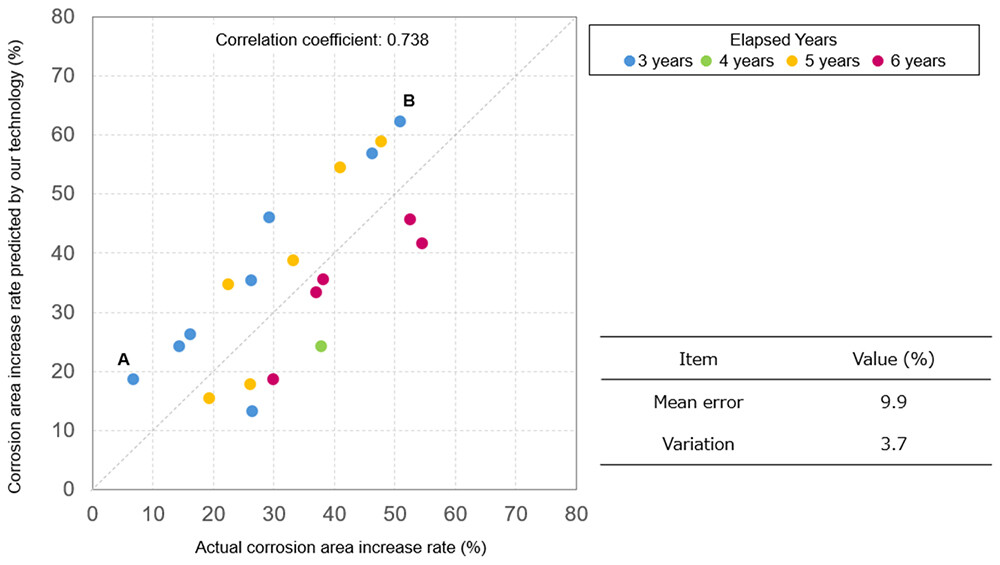 Figure 4 Verification Results of This Technology
Impact and Future Development of This Technology
• Impact of This Technology on the Infrastructure Maintenance Market
- This technology enables optimization of inspection intervals for each individual facility, replacing the conventional uniform schedule. As a result, it contributes to both reducing inspection costs and maintaining safe facility management. For facilities with slower corrosion progression, the inspection interval can be extended to reduce costs. For those with faster corrosion, shortening the interval helps ensure safe and reliable maintenance.
- Repairs can be scheduled at appropriate times, allowing for cost control while maintaining the safety and functionality of the facility. In addition, by forecasting the required repair volume over several years, it becomes possible to level out construction workloads, which supports stable budgeting for repairs and improved productivity on construction sites.
• Outlook
This technology is scheduled to be commercialized in fiscal year 2025 by NTT Group companies, targeting road bridges. Future plans also include expanding the application of this technology to other steel structures such as steel towers, as well as to other types of deterioration phenomena such as cracks and fractures.
Related Past Press Releases
NTT has been conducting research and development on image recognition technologies (image recognition AI) to improve the efficiency of infrastructure inspections, and has promoted real-world implementation through joint experiments with local governments.
This new technology follows previously commercialized technologies for corrosion detection and corrosion depth estimation, and represents the next advancement: prediction of corrosion progression. Going forward, NTT will continue its research and development efforts to help solve challenges such as rising maintenance costs for social infrastructure, contributing to the realization of a sustainable society.
- May 16, 2022; "NTT's Image Recognition AI Accurately Detects Rust in Social Infrastructure Facilities"
- May 13, 2024; "Established a technology to automatically estimate the depth of corrosion on steel materials in infrastructure facilities from images"
- October 3, 2024; "Demonstration test of a technology that enables image recognition AI to estimate the corrosion depth of steel materials for the digital transformation of social infrastructure inspection"
[Glossary]
1Corrosion spread rate
The percentage increase in the corroded pixel area between two images, using the corrosion area in a reference image as the baseline.
2Mean error
The average of the absolute differences between the actual corrosion progression rate and the predicted rate.
3Telecommunications conduit facilities
Pipes used to house communication cables and related infrastructure for attaching those pipes to structures such as road bridges.
4Tsukuba Forum 2025: https://www.rd.ntt/e/as/tforum/![]()
5Structural strength
The ability of a structure to withstand external forces such as its own weight, vehicles, earthquakes, and typhoons.
6Generative adversarial network (GAN)
A type of deep learning (neural network) model where two neural networks are trained to compete with each other. This competition enables the generation of highly realistic synthetic data based on a given dataset. The term "adversarial" reflects the competitive nature of the training process.
7Correlation coefficient
A measure of the strength of a linear relationship between two datasets. The closer the value is to 1, the stronger the positive correlation.
8Variance (σ)
The standard deviation of the absolute error between the actual corrosion progression rate and the predicted rate, indicating the consistency of prediction accuracy.
About NTT
NTT contributes to a sustainable society through the power of innovation. We are a leading global technology company providing services to consumers and businesses as a mobile operator, infrastructure, networks, applications, and consulting provider. Our offerings include digital business consulting, managed application services, workplace and cloud solutions, data center and edge computing, all supported by our deep global industry expertise. We are over $92B in revenue and 330,000 employees, with $3.6B in annual R&D investments. Our operations span across 80+ countries and regions, allowing us to serve clients in over 190 of them. We serve over 75% of Fortune Global 100 companies, thousands of other enterprise and government clients and millions of consumers.
Media contact
NTT Information Network Laboratory Group
Public Relations
Inquiry form![]()
Information is current as of the date of issue of the individual press release.
Please be advised that information may be outdated after that point.


NTT STORY
WEB media that thinks about the future with NTT