Microsoft ends support for Internet Explorer on June 16, 2022.
We recommend using one of the browsers listed below.
- Microsoft Edge(Latest version)
- Mozilla Firefox(Latest version)
- Google Chrome(Latest version)
- Apple Safari(Latest version)
Please contact your browser provider for download and installation instructions.


March 10, 2026
NTT, Inc.
NTT Identifies Brain Mechanism That Generates Variability in Human Movement for the First Time
--Opening new pathways for evaluating and improving motor performance in healthcare and sports--
News Highlights:
- Human movement inherently contains a certain degree of variability. For example, even highly skilled individuals cannot reproduce the same motion every time, often resulting in slight deviations from the intended target. Traditionally, this variability has been attributed mainly to fluctuations in the size of muscle activation in neural signals transmitted from the brain to the muscles.
- This study is the first in the world to demonstrate that across various types of arm movements, including reaching movements toward a target, periodic force-generation movements of the arm, and circular hand movements, movement variability is consistently associated not with fluctuations in muscle activation size but with fluctuations in the timing of muscle activation.
- This research challenges conventional theories of neural motor control and offers a new neuroscientific perspective for understanding a wide range of phenomena related to movement variability. By focusing on the timing of muscle activation, the findings may also lead to the development of new sports training approaches and rehabilitation assessment methods.
TOKYO — March 10, 2026 — NTT, Inc. (Headquarters: Chiyoda-ku, Tokyo; President and CEO: Akira Shimada; hereinafter "NTT") has revealed for the first time in the world that one of the primary factors underlying variability in human movement is fluctuations in the timing of muscle activation in the neural signals transmitted from the brain to the muscles.
When humans move their bodies, the brain sends motor commands to muscles, and movement is produced through the resulting muscle activity. However, all movements inevitably contain a certain degree of variability. This variability prevents people from moving their bodies as intended, affecting actions ranging from everyday movements to highly skilled sports performance. Understanding the mechanisms that generate such variability has long been an important challenge in research on neural motor control. Traditionally, fluctuations in the size of muscle activation have been considered the main cause.
In this study, the researchers closely examined the relationship between movement variability and muscle activity across various types of arm movements, including reaching movements, periodic movements, and circular movements. The results revealed that the factor most closely associated with movement variability is not fluctuations in muscle activation size, but fluctuations in the timing of muscle activation. Furthermore, the study showed that differences in movement variability between the dominant and non-dominant hands can also be explained by differences in the degree of variability in muscle activation timing.
These findings provide a new neuroscientific perspective for understanding a wide range of phenomena related to movement variability, including motor skill learning, movement disorders caused by disease, hand dominance, motor development, and age-related changes. By clarifying the primary source of movement variability, the results are also expected to contribute to the development of approaches based on monitoring and improving the timing of motor commands. Such approaches may support enhanced sports performance, new rehabilitation training methods, and quantitative methods for assessing health and motor function.
The results of this study were published in Neural Networks on March 2, 2026.
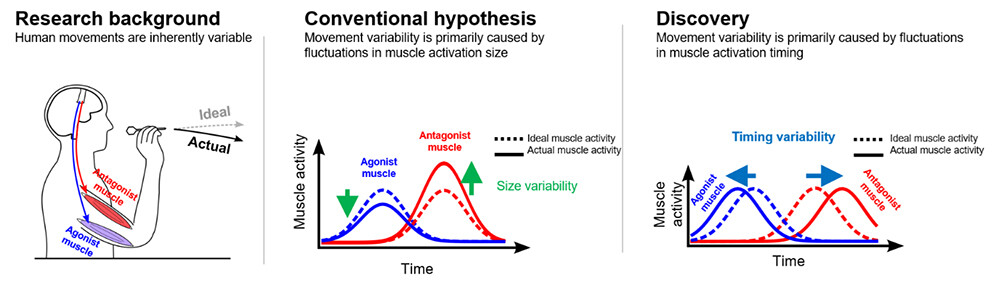 Figure 1 Overview of the study
The results reveal that variability in human movement is more closely associated with fluctuations in the timing of muscle activation than with fluctuations in muscle activation size, which has been the conventional explanation.
Background
NTT Communication Science Laboratories aims to achieve a fundamental understanding of human perception, sensibility, and body movement, and to propose new approaches for understanding and supporting embodied communication based on these foundational insights. Elucidating the neural information processing underlying human motor skills is regarded as a key research theme because it directly contributes to the quantification and improvement of motor performance.
In activities such as golf or darts, people may feel they are repeating the same movement each time. However, every movement contains small variations. This movement variability often causes the body to deviate slightly from the intended target and plays an important role in determining motor performance. Understanding the mechanisms that generate such variability has long been a central challenge in the field of motor control.
To fundamentally clarify this mechanism, it is necessary to understand how the brain sends motor commands to muscles to control the body. Achieving this requires a multidisciplinary approach that combines brain activity measurements, computational modeling, and behavioral experiments.
Conventional studies have generally attributed movement variability to fluctuations in muscle activation size, that is, variations in the magnitude of motor commands transmitted from the brain to the muscles. For example, when throwing a dart toward a target, the brain must appropriately switch the activity of the agonist and antagonist muscles of the elbow1 to control the acceleration and deceleration of the arm (Figure 1 left). According to the conventional view, small trial-to-trial fluctuations in the contraction of these two muscles lead to variability in the position of the hand and the trajectory of the dart (Figure 1 middle).
However, recent studies have reported cases in which the magnitude and direction of movement variability predicted from fluctuations in muscle activation size2 do not match experimental observations3. As a result, the primary cause of movement variability has not yet been fully explained.
In this study, the researchers focused on the timing of motor commands transmitted from the brain to the muscles, which has largely been overlooked in previous research. The results demonstrate for the first time that variability in the activation timing of agonist and antagonist muscles is the primary factor determining movement variability (Figure 1 right).
Research Findings
Considering the timing of motor commands, the dart-throwing example illustrates the importance of the activation timing of the agonist muscle that accelerates the arm and the antagonist muscle that decelerates the movement. If the timing of these muscle activations becomes imprecise, the motion of the dart becomes unstable, resulting in variability in the vertical direction.
From this perspective, the precision of muscle activation timing becomes increasingly important as movements become more complex and involve a larger number of muscles. Even small timing errors in the activation of individual muscles could therefore lead to substantial variability in the resulting movement.
In this study, the researchers designed multiple experimental tasks involving different types of arm movements that require distinct forms of muscle coordination, including reaching movements, periodic movements, and circular movements. Using simultaneously measured motion and muscle activity data, they conducted a detailed analysis of the relationship between movement variability and muscle activity.
The results revealed that across all movement tasks, the factor most closely associated with movement variability was not fluctuations in muscle activation size but fluctuations in the timing of muscle activation.
(1) Variability in the Endpoint of Reaching Movements
Fifteen participants performed a reaching task while holding a robotic handle used for motion measurement. By bending the elbow, they moved their hand from a starting position to a target position, repeating the same reaching movement 50 times (Figure 2 left). Although participants attempted to perform the same movement each time, clear trial-to-trial variability in the reaching endpoint was observed (Figure 2 upper middle).
Muscle activity associated with elbow movement was measured using electrodes attached to the surface of the skin. The results showed alternating activation of the agonist muscle that accelerates the hand and the antagonist muscle that decelerates the movement (Figure 2 lower middle). In addition to trial-to-trial fluctuations in activation size, variability was also observed in the timing of muscle activation, defined as the time required to reach peak activity.
An analysis of the relationship between movement variability and muscle activity revealed that variability in hand position was not associated with fluctuations in muscle activation size. In contrast, it was significantly associated with variability in muscle activation timing (Figure 2 right). These findings suggest that movement variability in reaching movements can largely be explained by fluctuations in the timing of muscle activation.
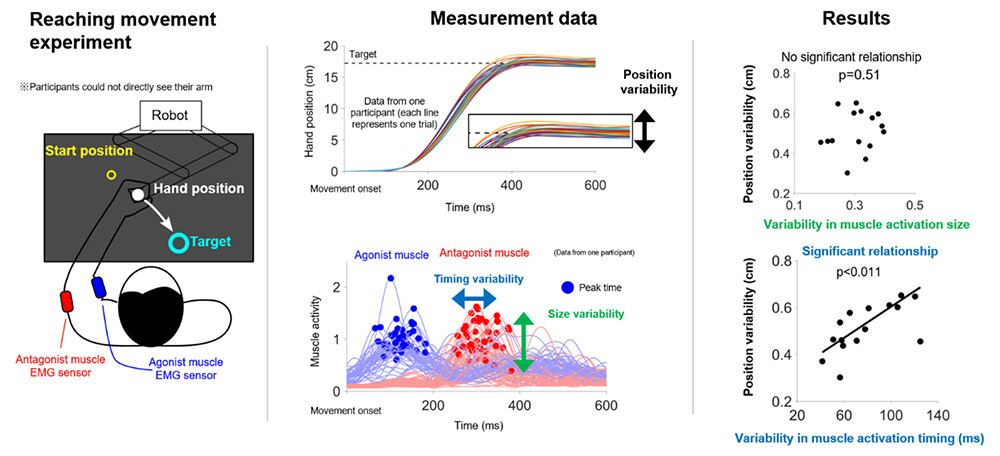 Figure 2
(Left) Top-view schematic of the arm-reaching task and muscle activity measurements.
(Middle) The endpoint of the hand varies across trials. From the muscle activity associated with the movement, variability in activation size and variability in activation timing were calculated. For each measure, the average values of the agonist and antagonist muscles were used to evaluate muscle activity variability for each participant.
(Right) Movement variability is not associated with variability in muscle activation size but is significantly associated with variability in muscle activation timing. Each plot represents data from an individual participant. The presence of a relationship was analyzed using a linear mixed-effects model4 and was considered significant when the p-value was less than 0.05.
(2) Variability in Force During Periodic Movements
Next, the researchers examined whether a similar pattern would be observed in periodic movements, such as those involved in drumming. Previous studies have suggested that periodic movements are controlled by neural mechanisms different from those of discrete reaching movements. Therefore, the researchers investigated whether variability in muscle activation timing could also explain variability in periodic movements. In addition, to examine differences in motor performance between the dominant and non-dominant hands, measurements were conducted for both arms.
Fifteen participants (all right-handed)5 grasped a fixed robotic handle and performed a task in which they generated a constant level of force with either the left or right arm in synchrony with a metronome rhythm (Figure 3 left)6. During the rhythmic force production (Figure 3 middle, upper panel), muscle activity was measured for six muscles in total, including the agonist and antagonist muscles associated with the wrist, elbow, and shoulder. Periodic muscle activity was observed in each of these muscles.
Muscle activity for each cycle was extracted, and variability in both activation size and activation timing was evaluated. The results are shown in Figure 3 middle (lower panel), which presents representative examples of the left and right wrist muscles from a typical participant.
First, to examine the effect of handedness, movements performed with the left and right arms were compared. When participants used the left arm, which showed greater variability in force production, variability in muscle activation timing tended to be larger than when using the right arm. An analysis of wrist data from all participants revealed that this left-right difference was clearly observed in variability of muscle activation timing, whereas it was not pronounced in variability of muscle activation size (Figure 3 right, comparison of white and black circles).
Next, the relationship between variability in force production and variability in muscle activity was analyzed using a linear mixed-effects model, as in Experiment (1). Consistent with the results of Experiment (1), variability in force production was not associated with fluctuations in muscle activation size but was significantly associated with variability in muscle activation timing (Figure 3 right). Furthermore, these trends were consistently observed not only in the wrist, as shown in the figure, but also in the elbow and shoulder.
These results suggest that in periodic movements as well, variability in force production is closely related to variability in muscle activation timing. They also indicate that increased variability in force production in the non-dominant hand may be explained by greater variability in muscle activation timing.
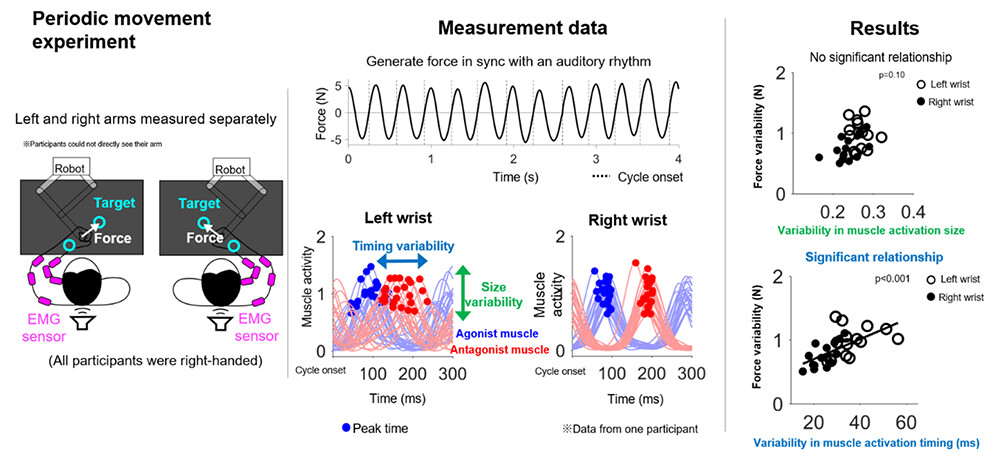 Figure 3
(Left) Periodic movement task and muscle activity measurements.
(Middle) Muscle activity for each cycle was extracted from the periodically generated force, and variability in activation size and activation timing was calculated (example from a typical participant, wrist muscles).
(Right) Variability in force production is not associated with variability in muscle activation size but is significantly associated with variability in muscle activation timing (wrist example). Variability in muscle activity was evaluated using the average values of the agonist and antagonist muscles.
(3) Variability in Acceleration During Circular Movements
The results so far indicate that variability in muscle activation timing plays a key role in movement variability. In general, as movements become more complex and involve a larger number of muscles, the precision of timing for each muscle becomes increasingly important. Even small timing errors may therefore lead to substantial variability in the resulting movement. To examine this possibility, Experiment (3) focused on circular movements, which require coordinated activity among many muscles. Using the same participants as in Experiment (2), the researchers investigated the relationship between variability in circular movements and variability in muscle activation timing.
In this experiment, participants held a smartphone in one hand and traced a guide circle printed on paper held by the other hand (Figure 4 left). The circular movement was performed continuously for 15 seconds in synchrony with a metronome set at 2.5 Hz, corresponding to 2.5 rotations per second. Analysis of acceleration data obtained from the smartphone showed that the degree of variability in circular movement7 differed substantially across participants and depending on which arm was used.
Examples of circular movements from four participants (A and B using the right arm, C and D using the left arm) are shown in Figure 4 middle (upper panel). The variability in circular movement increases from A to D. Figure 4 middle (lower panel) shows the results for all 15 participants, with variability in muscle activation size (mean across six muscles) and variability in muscle activation timing, each arranged in ascending order for both arms. When the four example participants (A to D) are mapped onto these plots, the magnitude of variability in muscle activation size does not necessarily correspond to the magnitude of circular movement variability. In contrast, variability in muscle activation timing tends to increase as variability in circular movement becomes larger.
A detailed analysis of the relationship between movement variability and muscle activity, conducted using the same methods as in Experiments 1 and 2, revealed that even in circular movements, movement variability is consistently associated with variability in muscle activation timing rather than with fluctuations in muscle activation size (Figure 4 right).
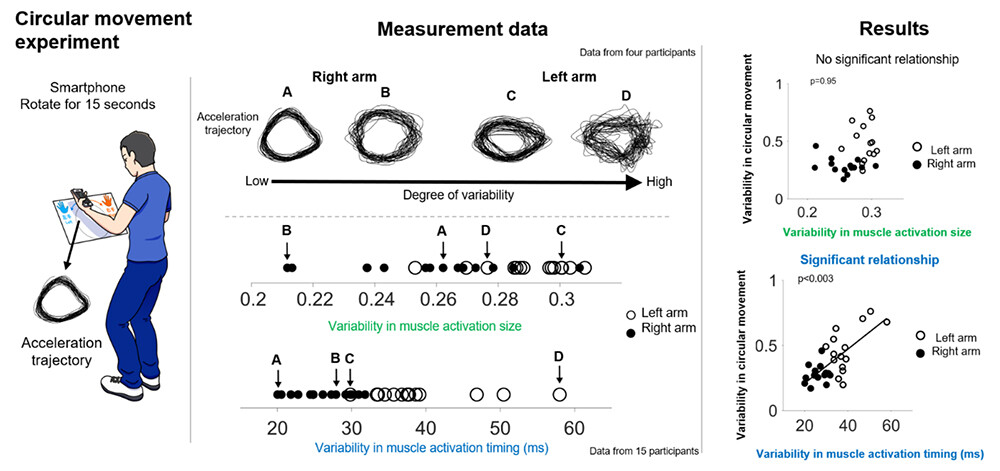 Figure 4
(Left) Circular movement task using a smartphone.
(Middle, upper) Examples of acceleration trajectories during circular movements and the corresponding variability for four participants. The degree of variability increases from A to D.
(Middle, lower) Results for all 15 participants, arranged in ascending order according to variability in muscle activation size and variability in muscle activation timing. Variability in muscle activity was calculated as the mean across six muscles. Participants with greater variability in muscle activation timing tend to show greater variability in circular movement, whereas a clear trend is not observed for variability in activation size.
(Right) Variability in circular movement is not associated with variability in muscle activation strength but is significantly associated with variability in muscle activation timing.
Future Directions
In this study, the researchers demonstrated that across different types of arm movements, including reaching, periodic, and circular motions, the primary factor consistently associated with movement variability is not fluctuations in muscle activation size but fluctuations in the timing of muscle activation.
In future work, the team plans to combine behavioral experiments with brain activity measurements and theoretical studies to identify the brain regions and neural representations that control the timing of muscle activation. This approach is expected to advance the neuroscientific understanding of a wide range of phenomena related to movement variability, including motor skill learning, movement disorders caused by disease, hand dominance, motor development, and age-related changes.
NTT also aims to apply the findings of this research across a broad range of fields, including sports and healthcare. In the field of sports, for example, movement variability could be used to visualize individual skill characteristics and support the development of tailored training methods designed to improve performance. In medical and rehabilitation settings, the findings may contribute to the development of new indicators for easily and appropriately assessing the degree of motor impairment in patients with movement disorders, as well as methods to support functional recovery.
Related Press Releases
- June 17, 2024
NTT developed a method to quantify hand and foot skill by moving a smartphone (https://group.ntt/en/newsrelease/2024/06/17/240617b.html)
Paper Information
Journal: Neural Networks
Title: Minimizing command timing variability is a key factor in skilled actions
Authors: Atsushi Takagi, Sho Ito, Hiroaki Gomi
DOI: https://doi.org/10.1016/j.neunet.2026.108759![]()
URL: https://www.sciencedirect.com/science/article/pii/S0893608026002212![]()
[Glossary]
1Agonist and antagonist muscles:
The muscle that plays the primary role in producing a particular movement is called the agonist muscle, while the muscle that acts in the opposite direction is called the antagonist muscle.
2Fluctuation / variability:
In this study, fluctuations or variability in movement or muscle activity refer to the standard deviation calculated across trials.
3Van Beers, R. J., Haggard, P., & Wolpert, D. M. (2004). The role of execution noise in movement variability. Journal of neurophysiology, 91(2), 1050-1063.
4Linear mixed-effects model:
A statistical analysis method used to evaluate relationships between variables while accounting for factors such as individual differences.
5Right-handed participants:
Handedness was determined using a questionnaire-based assessment, the Edinburgh Handedness Inventory.
6Periodic movement task:
Participants generated force using the wrist, elbow, and shoulder joints. Variability in the activation size and timing of the corresponding agonist and antagonist muscles was measured. Auditory rhythm cues (metronome) were presented at three conditions: 3, 4, and 5 Hz.
7Variability of circular movement:
A metric that evaluates the variability of repeated circular movements based on the similarity of acceleration trajectories across trials.
About NTT
NTT is a leading global technology innovator, providing a broad range of services to both consumers and businesses. As a mobile operator and provider of infrastructure, networks, and services, NTT is dedicated to promoting a sustainable future through cutting-edge innovations. Our portfolio includes business consulting, AI-powered solutions, application services, global networks, cybersecurity, data center and edge computing, all supported by our deep global industry expertise. Generating over $90 billion in revenue and employing 340,000 professionals, we allocate 30% of our annual profits to fundamental research and development. With operations spanning more than 70 countries and regions, our clients include over 75% of Fortune Global 100 companies, alongside thousands of enterprises, government organizations, and millions of consumers.
Media Contact
NTT, Inc.
NTT Science and Core Technology Laboratory Group
Public Relations
Inquiry Form![]()
Information is current as of the date of issue of the individual press release.
Please be advised that information may be outdated after that point.


NTT STORY
WEB media that thinks about the future with NTT