Microsoft ends support for Internet Explorer on June 16, 2022.
We recommend using one of the browsers listed below.
- Microsoft Edge(Latest version)
- Mozilla Firefox(Latest version)
- Google Chrome(Latest version)
- Apple Safari(Latest version)
Please contact your browser provider for download and installation instructions.
August 20, 2024
NTT Corporation
World's first and most accurate field demonstration of end-to-end visualization of fiber-optic link without measuring equipment
Enables fast optical connection and maintenance through the realization of the digital twin of optical network
News Highlights:
- Developed a technology to visualize optical signal power over the entire fiber-optic link using optical transceivers installed at the end of an optical network in just a few minutes
- The world's first and most accurate demonstration in a field environment simulating a commercial network
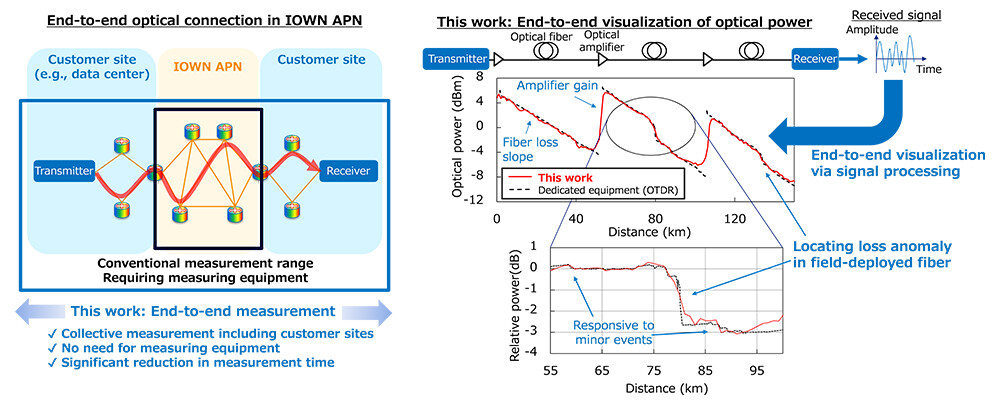
- This technology makes it possible to run a diagnosis on the entire fiber-optic link including customer sites without using a dedicated measuring instrument, significantly reducing the time required for designing and maintaining optical networks
TOKYO - August 20, 2024 - NTT Corporation (Headquarters: Chiyoda Ward, Tokyo; Representative Member of the Board and President: Akira Shimada; hereinafter "NTT") has developed technology to visualize the state of end-to-end fiber-optic links without using measuring equipment and succeeded for the first time in demonstrating the world's highest accuracy in a North American field-deployed environment simulating a commercial network. This technology will advance the realization of digital twins1 in optical networks and is expected to be applied to the fast establishment and maintenance of end-to-end optical connections including IOWN2 APN3.
These results were presented in the Postdeadline Paper Session [1] at the OFC2024 (The Optical Fiber Communication Conference and Exhibition), the largest global conference and exhibition for optical communications held in San Diego, California, from March 24-28, 2024.
1. Background
NTT Group is developing the IOWN APN (All-Photonics Network) which is a next-generation infrastructure that enables high-capacity, low-latency, and low power consumption communications through end-to-end optical connections without converting optical signals into electrical signals. To maximize the data transmission capacity of optical networks, it is necessary to closely monitor and control the state of fiber-optic links, such as optical signal power. To achieve this, the application of digital twins in optical networks is being widely studied.
The digital twin of an optical network is a virtual optical network reproduced in cyberspace. By analyzing and predicting its optical transmission performance, it is possible to quickly predict failures and maximize the data transmission capacity of a real optical network. However, there are currently two issues to be addressed in the implementation of digital twins. First, to precisely replicate a real optical network, it is necessary to place a large number of sensors or dedicated measuring instruments at every optical node, which increases the time and cost of sensor installation/operation. In some cases, when network faults occur, highly skilled workers are required to perform on-site measurements using specialized instruments such as optical time domain reflectometers (OTDR)4. Second, when optical connections are made between remote user locations using IOWN APN, the monitoring range of the fiber-optic link must be extended to the user sites. In such an optical network covering multiple organizations, it becomes difficult to access sensor information such as optical signal power beyond administrative boundaries due to security issues.
 Figure 1 End-to-end visualization of optical signal power along fiber-optic link solely by analyzing received signal
2. Result of the research
The three main results of this research are as follows.
- Development of Digital Longitudinal Monitoring (DLM) [2], which visualizes the end-to-end optical signal power along an fiber-optic link solely from the signal reaching an optical receiver installed at network endpoints in only a few minutes without the use of specialized measuring instruments
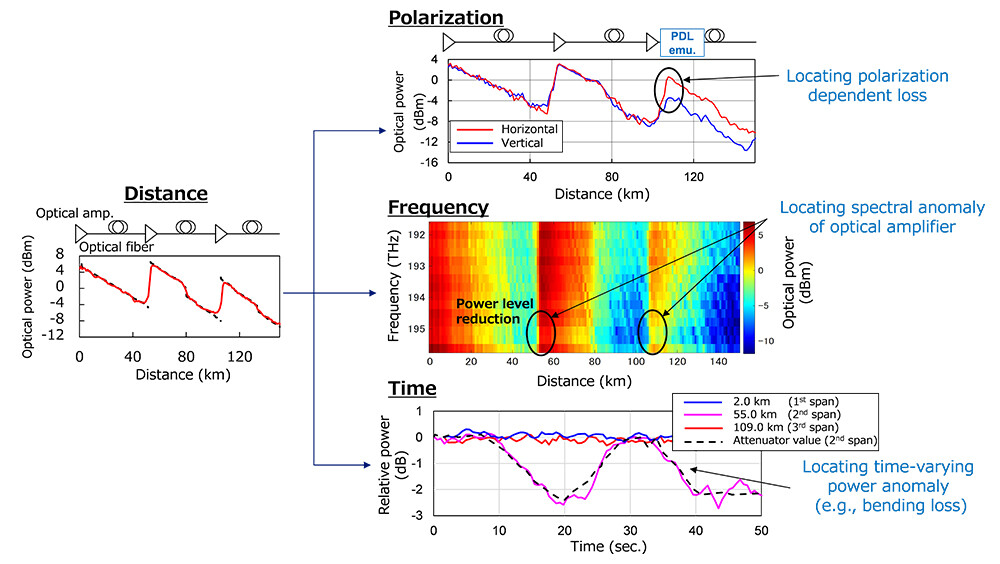
- Development of a four-dimensional optical power visualization technology that extends the visualization of optical signal power not only in the direction of distance but also in the time, frequency, and polarization (Figure 2).
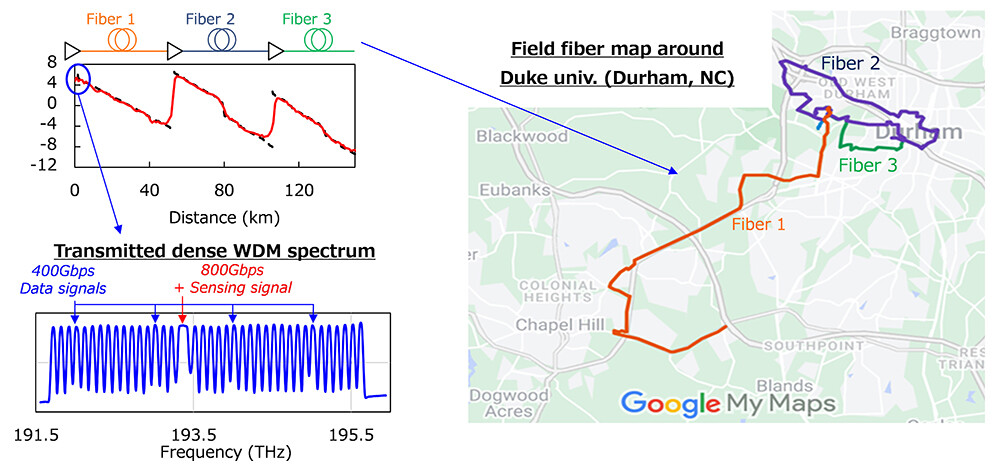
- The world's first successful demonstration with the highest accuracy using North American field-deployed optical fiber and commercial optical transceiver [3] in a joint experiment with Duke University and NEC Laboratories America, Inc. (Figure 3).
These results show that the measurement of the state of fiber-optic links, which is necessary for the construction of an optical network, can be performed only with optical transceivers by using DLM technology. This enables the simultaneous measurement of all optical fibers and amplifiers between customer sites without the need for dedicated measuring instruments, greatly reducing the time required to design optical connections and identify abnormalities [4].
<Details of the developed technology>
( 1 ) Digital Longitudinal Monitoring (DLM) technology
This DLM technology applies advanced digital signal processing to the received signal waveform reaching an optical receiver to visualize the optical power distributed in the longitudinal direction of the fiber-optic link (Figure 1). In general, it is extremely difficult to find distributed parameters inside a system solely from the input and output waveforms of the system, as often known as ill-posed problems. To solve this issue, NTT focused on the fact that the propagation of optical signals in optical fibers follows the nonlinear Schrödinger equation5, and mathematically formulated the problem of visualizing optical power for the first time in the world as an inverse problem, and succeeded in deriving a solution. This makes it possible to visualize optical power at high speed and with high accuracy. This technology was presented as a Postdeadline paper [1] at the global conference OFC2024 and was also exhibited using the live demonstration network "OFCnet" at the conference exhibition [5]. After the presentation and exhibition, NTT has continued its development efforts, further refining this technology toward practical application.
( 2 ) Four-dimensional optical power visualization technology
In addition to the visualization of optical signal power in the distance direction, we succeeded in developing a four-dimensional DLM technology that extends in the polarization, frequency, and time directions, and demonstrated it in the same field environment (Figure 2). This dimension expansion makes it possible to locate multiple types of anomalies in an fiber-optic link.
The details of optical power visualization technology for polarization, frequency, and time directions are as follows.
- Polarization direction: By adopting the Manakov equation6 as a model to describe dual-polarization transmission in optical fibers, the optical power distribution of horizontally and vertically polarized signals can be visualized independently (Figure 2, upper right column). This makes it possible to measure the distribution of polarization dependent loss (PDL)7, which was not possible in conventional optical networks [6].
- Frequency direction: By performing DLM using optical signals of multiple frequency channels in wavelength division multiplexing (WDM)8 transmission systems, it became possible to obtain optical power distribution along the frequency axis at an arbitrary distance (Figure 2, middle right). Consequently, this enables the localization of anomalies in frequency characteristics of optical amplifiers and detailed monitoring of optical power transitions between signals due to Raman scattering9, which will become apparent in next-generation wideband optical transmission systems [7].
- Time direction: By implementing the high-speed waveform acquisition function in the optical transceiver, the time variation of optical signal power can be continuously visualized from the received signal waveform. As a result, the location of the cause of the time fluctuation of the optical power generated in the fiber optic link, such as the bending loss of the optical fiber by the operator, can be identified. (Figure 2, lower right)
 Figure 2 Four-dimensional (distance, polarization, frequency, and time) optical power visualization technology
3.Outline of the demonstration experiment
In this experiment, NTT demonstrated DLM technology in a field environment using optical fibers and commercial optical transceivers installed in Durham, North Carolina, U.S. [3] (Figure 3). This experiment was conducted jointly by NTT, Duke University, and NEC Laboratories America Inc., with Duke University providing field-installed optical fibers and laboratory equipment, and NEC Laboratories America Inc., providing laboratory equipment and optimization. In addition to using field-deployed optical fibers, this demonstration experiment was successful under conditions simulating a commercial optical network in which high-density WDM transmission8 is carried out using 800Gbps commercial optical transceivers, demonstrating the feasibility of this technology.
 Figure 3 Field Deployed fiber map and Dense WDM spectrum used in this experiment
4.Outlook
This technology is expected to diagnose an fiber-optic link in just a few minutes without using a dedicated measuring instrument, realizing rapid optical connection and maintenance. To further develop IOWN APN, NTT will advance its proprietary optical network visualization technology, and research and development to realize the autonomous operation of optical networks using digital twins.
[Reference]
[1]T. Sasai, G. Borraccini, Y. K. Huang, H. Nishizawa, Z. Wang, T. Chen, Y. Sone, T. Matsumura, M. Nakamura, E. Yamazaki, and Y. Kisaka, "4D Optical Link Tomography: First Field Demonstration of Autonomous Transponder Capable of Distance, Time, Frequency, and Polarization Resolved Monitoring," Optical Fiber Communication Conference and Exhibition (OFC), Th4B.7, 2024.
[2]T. Sasai, M. Nakamura, E. Yamazaki, S. Yamamoto, H. Nishizawa, and Y. Kisaka, "Digital Longitudinal Monitoring of Optical Fiber Communication Link," Journal of Lightwave Technology, vol. 40, no. 8, pp. 2390-2408,2022.
[3]Duke University News Release "Pushing the Limits and Advancing the Capabilities of Fiber-Optic Networks" https://pratt.duke.edu/news/2024-ofc-paper-awards/
[4]News release "Establishment and validation of optical wavelength path provisioning technology based on IOWN APN architecture for data center exchange services" https://group.ntt/en/newsrelease/2023/10/13/231013a.html
[5]News release "400Gbps/800Gbps IOWN APN demonstration at OFC2024 by multi-vendor products leveraging photonics-electronics convergence device and open standards" https://group.ntt/en/newsrelease/2024/03/26/240326a.html
[6]M. Takahashi, T. Sasai, E. Yamazaki and Y. Kisaka, "Monitoring PDL Value and Location Using DSP-Based Longitudinal Power Profile Estimation," Journal of Lightwave Technology, (early access).
[7]R. Kaneko, T. Sasai, F. Hamaoka, M. Nakamura, and E. Yamazaki, "Fiber-Longitudinal Monitoring of Inter-band-SRS-induced Power Transition in S+C+L WDM Transmission," Optical Fiber Communication Conference and Exhibition (OFC), W1B.4, 2024.
1.Digital twin
A technology to reproduce people and objects in cyberspace using data collected from the real world. The purpose is to analyze and predict individual objects reproduced in cyberspace, and to utilize the results of the analysis in the real world.
https://www.rd.ntt/e/iown/0003.html
2.Innovative Optical and Wireless Network (IOWN)
A network and information processing infrastructure including devices that can provide high-speed, large-capacity communications and enormous computing resources by optimizing both the individual and the entire system based on various information and utilizing innovative technologies centered on optics. NTT News Release: "NTT Technology Report for Smart World: What's IOWN?"
https://group.ntt/jp/newsrelease/2019/05/09/190509b.html
3.All-Photonics Network (APN)
An innovative network based on photonics technology whose architecture is being developed openly at the IOWN Global Forum. As a network supporting IOWN use cases, it enables direct optical connections between user sites.
https://www.rd.ntt/e/iown/
4.Optical time domain reflectometer (OTDR)
An instrument that measures the loss of an optical fiber in a distributed manner by measuring the time it takes for light to enter from one end of the optical fiber and to reflect back in the optical fiber.
5.Nonlinear Schrodinger equation
A partial differential equation that a single polarization of light follows as it propagates through an optical fiber.
6.Manakov equation
A partial differential equation that two orthogonally polarized lights follows as they propagate through an optical fiber.
7.Polarization dependent loss (PDL)
A phenomenon that causes different losses depending on the polarization state of light. In polarization-multiplexed optical transmission, PDL degrades signal quality and causes an increase in the error rate of data.
8.Wavelength division multiplexing (WDM)
A method for simultaneously transmitting multiple different wavelengths on an optical transmission line by using the property that different wavelengths do not interfere with each other. Especially, the WDM which realizes the large capacity optical transmission by densely multiplexing the wavelength channels is called Dense WDM (DWDM).
9.Raman scattering
A nonlinear scattering phenomenon that occurs when light enters a substance. In optical fiber communication, it is applied to a Raman amplifier for realizing long-distance transmission, while in wide-band optical signal transmission, it introduces issue that the design of a transmission system becomes complicated because of the transition of optical power from a shorter wavelength to a longer wavelength optical signal.
About NTT
NTT contributes to a sustainable society through the power of innovation. We are a leading global technology company providing services to consumers and businesses as a mobile operator, infrastructure, networks, applications, and consulting provider. Our offerings include digital business consulting, managed application services, workplace and cloud solutions, data center and edge computing, all supported by our deep global industry expertise. We are over $97B in revenue and 330,000 employees, with $3.6B in annual R&D investments. Our operations span across 80+ countries and regions, allowing us to serve clients in over 190 of them. We serve over 75% of Fortune Global 100 companies, thousands of other enterprise and government clients and millions of consumers.
Media contact
NTT Science and Core Technology Laboratory Group
Public Relations
nttrd-pr@ml.ntt.com
Information is current as of the date of issue of the individual press release.
Please be advised that information may be outdated after that point.
NTT STORY
WEB media that thinks about the future with NTT


