Microsoft ends support for Internet Explorer on June 16, 2022.
We recommend using one of the browsers listed below.
- Microsoft Edge(Latest version)
- Mozilla Firefox(Latest version)
- Google Chrome(Latest version)
- Apple Safari(Latest version)
Please contact your browser provider for download and installation instructions.


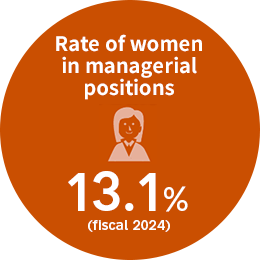
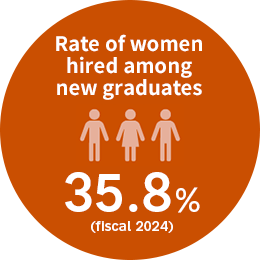
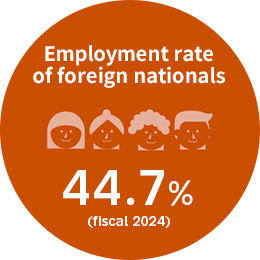
Diversity Data
Find data collection related to the diversity at NTT
-
 Among main NTT companies
 -
 Among main NTT companies
-
 Among Group companies
in Japan and abroad -
 Among Group companies
in Japan and abroad
-
 Among main NTT companies
 -
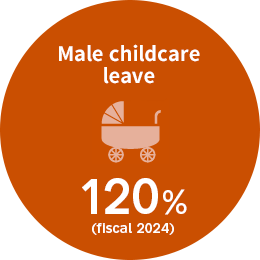 Ratio of male employees who took childcare
leave or related absences
(Number of male employees with children up
to elementary school entry age who took
childcare-related leave in FY2023) ÷
(Number of employees whose partners gave
birth in FY2023) -
*The above data was published in September 2024.
Please refer to the Integrated Report for details.>>>Detailed data
*You can scroll horizontally
| Unit | Fiscal 2017 | Fiscal 2018 | Fiscal 2019 | |||
|---|---|---|---|---|---|---|
| Total employees | People | 284,544 | 307,894 | 319,039 | ||
| By region | Japan | 166,173 | 179,902 | 183,824 | ||
| Overseas | 118,371 | 127,992 | 135,215 | |||
| Percentage of overseas employees | % | 41.6 | 41.6 | 42.4 | ||
| By gender | People | 109,200 | 106,997 | 110,207 | ||
| Male | 92,000 | 88,756 | 88,724 | |||
| Female | 17,200 | 18,241 | 21,483 | |||
| Percentage of female employees | % | 15.8 | 17.0 | 19.5 | ||
| Number of new graduates employed | People | 1,550 | 1,721 | 1,877 | ||
| Male | 1,022 | 1,170 | 1,270 | |||
| Female | 528 | 551 | 607 | |||
| Percentage of female employees | % | 34.1 | 32.0 | 32.3 | ||
| Average age | Age | 41.3 | 41.3 | 41.1 | ||
| Male | 41.7 | 41.7 | 41.7 | |||
| Female | 37.4 | 37.6 | 37.1 | |||
| Average years of service | Years | 16.8 | 16.8 | 16.7 | ||
| Male | 17.2 | 17.2 | 17.1 | |||
| Female | 13.4 | 13.5 | 13.3 | |||
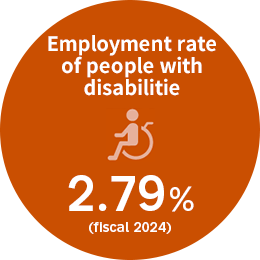
| Employment rate of people with disabilities | Non-consolidated | % | 2.6 | 2.7 | 2.7 | |
| Major companies* | 2.5 | 2.6 | 2.6 | |||
*The data is from our major companies (NTT, NTT EAST, NTT WEST, NTT DOCOMO BUSINESS, NTT DOCOMO, NTT DATA, NTT FACILITIES, NTT COMWARE).
Diversity and Inclusion
NTT STORY
WEB media that thinks about the future with NTT